What the NSW renovations that paid off had in common
·
Archive Design matches homeowners with architects and earns a fee when a homeowner goes ahead with an introduction. This paper does not find or claim that architect-designed renovations perform better; that question is the subject of a separate study.
- Does renovating add value in NSW?
- Key statistics
- Why study whether renovations pay?
- How often does a renovation pay for itself?
- Which NSW areas get the best return?
- How much should you spend?
- How do you plan a renovation that pays?
- What other research says
- Does the designer make the difference?
- How was this study done?
- Frequently asked questions
- About this paper
Does renovating add value in NSW?
Sometimes a lot, but not reliably. Of 1,139 NSW houses resold after a development application for alterations and additions between 2019 and October 2026, 53% sold for more than local market growth plus the declared renovation cost. The renovations that paid off tended to keep the budget in proportion to the house's value, cost $300,000 to $500,000, and sit in high-demand areas such as the Northern Beaches and the Inner West.
These figures describe houses that were resold, not all renovations, and not owners who renovated and stayed. "Ahead" means the house sold for more than local market growth plus the declared renovation cost, measured before selling costs, interest and tax. The patterns are associations: this study can't show that budget or location caused the results.
Key statistics
$526,000+
Of 1,139 NSW houses resold after a renovation application between 2019 and 2026, a quarter came out $526,000 or more ahead of market growth plus declared cost, and about one in six (181 houses) more than $800,000 ahead.
$216,000
NSW renovation projects with a declared cost of $300,000 to $500,000 had the best typical result: a median gain of $216,000 after declared cost, with 57% of houses ahead.
59%
Where a NSW renovation cost 20–30% of the purchase price, 59% of houses came out ahead, with a typical gain of $162,000. Below 30%, the median result was positive in every spending band.
$300,000+
On Sydney's Northern Beaches (60% ahead) and in the Inner West (65% ahead), the typical gain after declared renovation cost was more than $300,000. Across Greater Sydney, 55% came out ahead, compared with 48% in regional NSW.
53%
Renovating in NSW isn't a guaranteed return: overall, 53% of resold houses came out ahead and the typical result was close to break-even, a median gain of $45,000 before selling costs, interest and tax that fell as low as about −$8,000 under alternative assumptions. In every version tested, the share ahead stayed between 49% and 53%.
36%
Where a NSW renovation cost more than half the purchase price, only 36% of houses came out ahead, with a typical loss of $150,000 after declared cost.
Why study whether renovations pay?
Every homeowner planning a renovation asks the same thing: will it pay for itself? Most of the answers come from agents, builders and designers, who all have a stake in the reply.
The few public studies tend to compare renovated homes with untouched ones, or design-marketed listings with the rest. That shows renovated homes are worth more, which is expected. It doesn't show whether they're worth more by more than the renovation cost. That is the question that matters to someone deciding whether to spend $300,000 on their house. A 2020 University of Melbourne study for Architeam measured faster capital growth after architect-led renovations in Melbourne, but it didn't net off what the work cost.
NSW is one of the few places where this can be measured from public data. The NSW Valuer General publishes every property sale, and the NSW Planning Portal publishes every development application along with its declared cost.
How often does a renovation pay for itself?
The median house in the study sold for $270,000 more than local market growth alone would predict, and the median declared cost was $286,000. These are separate medians. Measured house by house, the median gain after declared cost was $45,000: close to break-even, and before selling costs, interest and tax.
The average result was higher, at $107,000 ahead, because a minority of houses did very well. That gap between the typical and the average outcome is the point. A renovation can pay handsomely, but the typical owner shouldn't count on it.
Renovation outcomes after declared cost were spread widely
Number of NSW houses by gain or loss after declared cost · 47% came out behind, 53% ahead · 1,139 houses
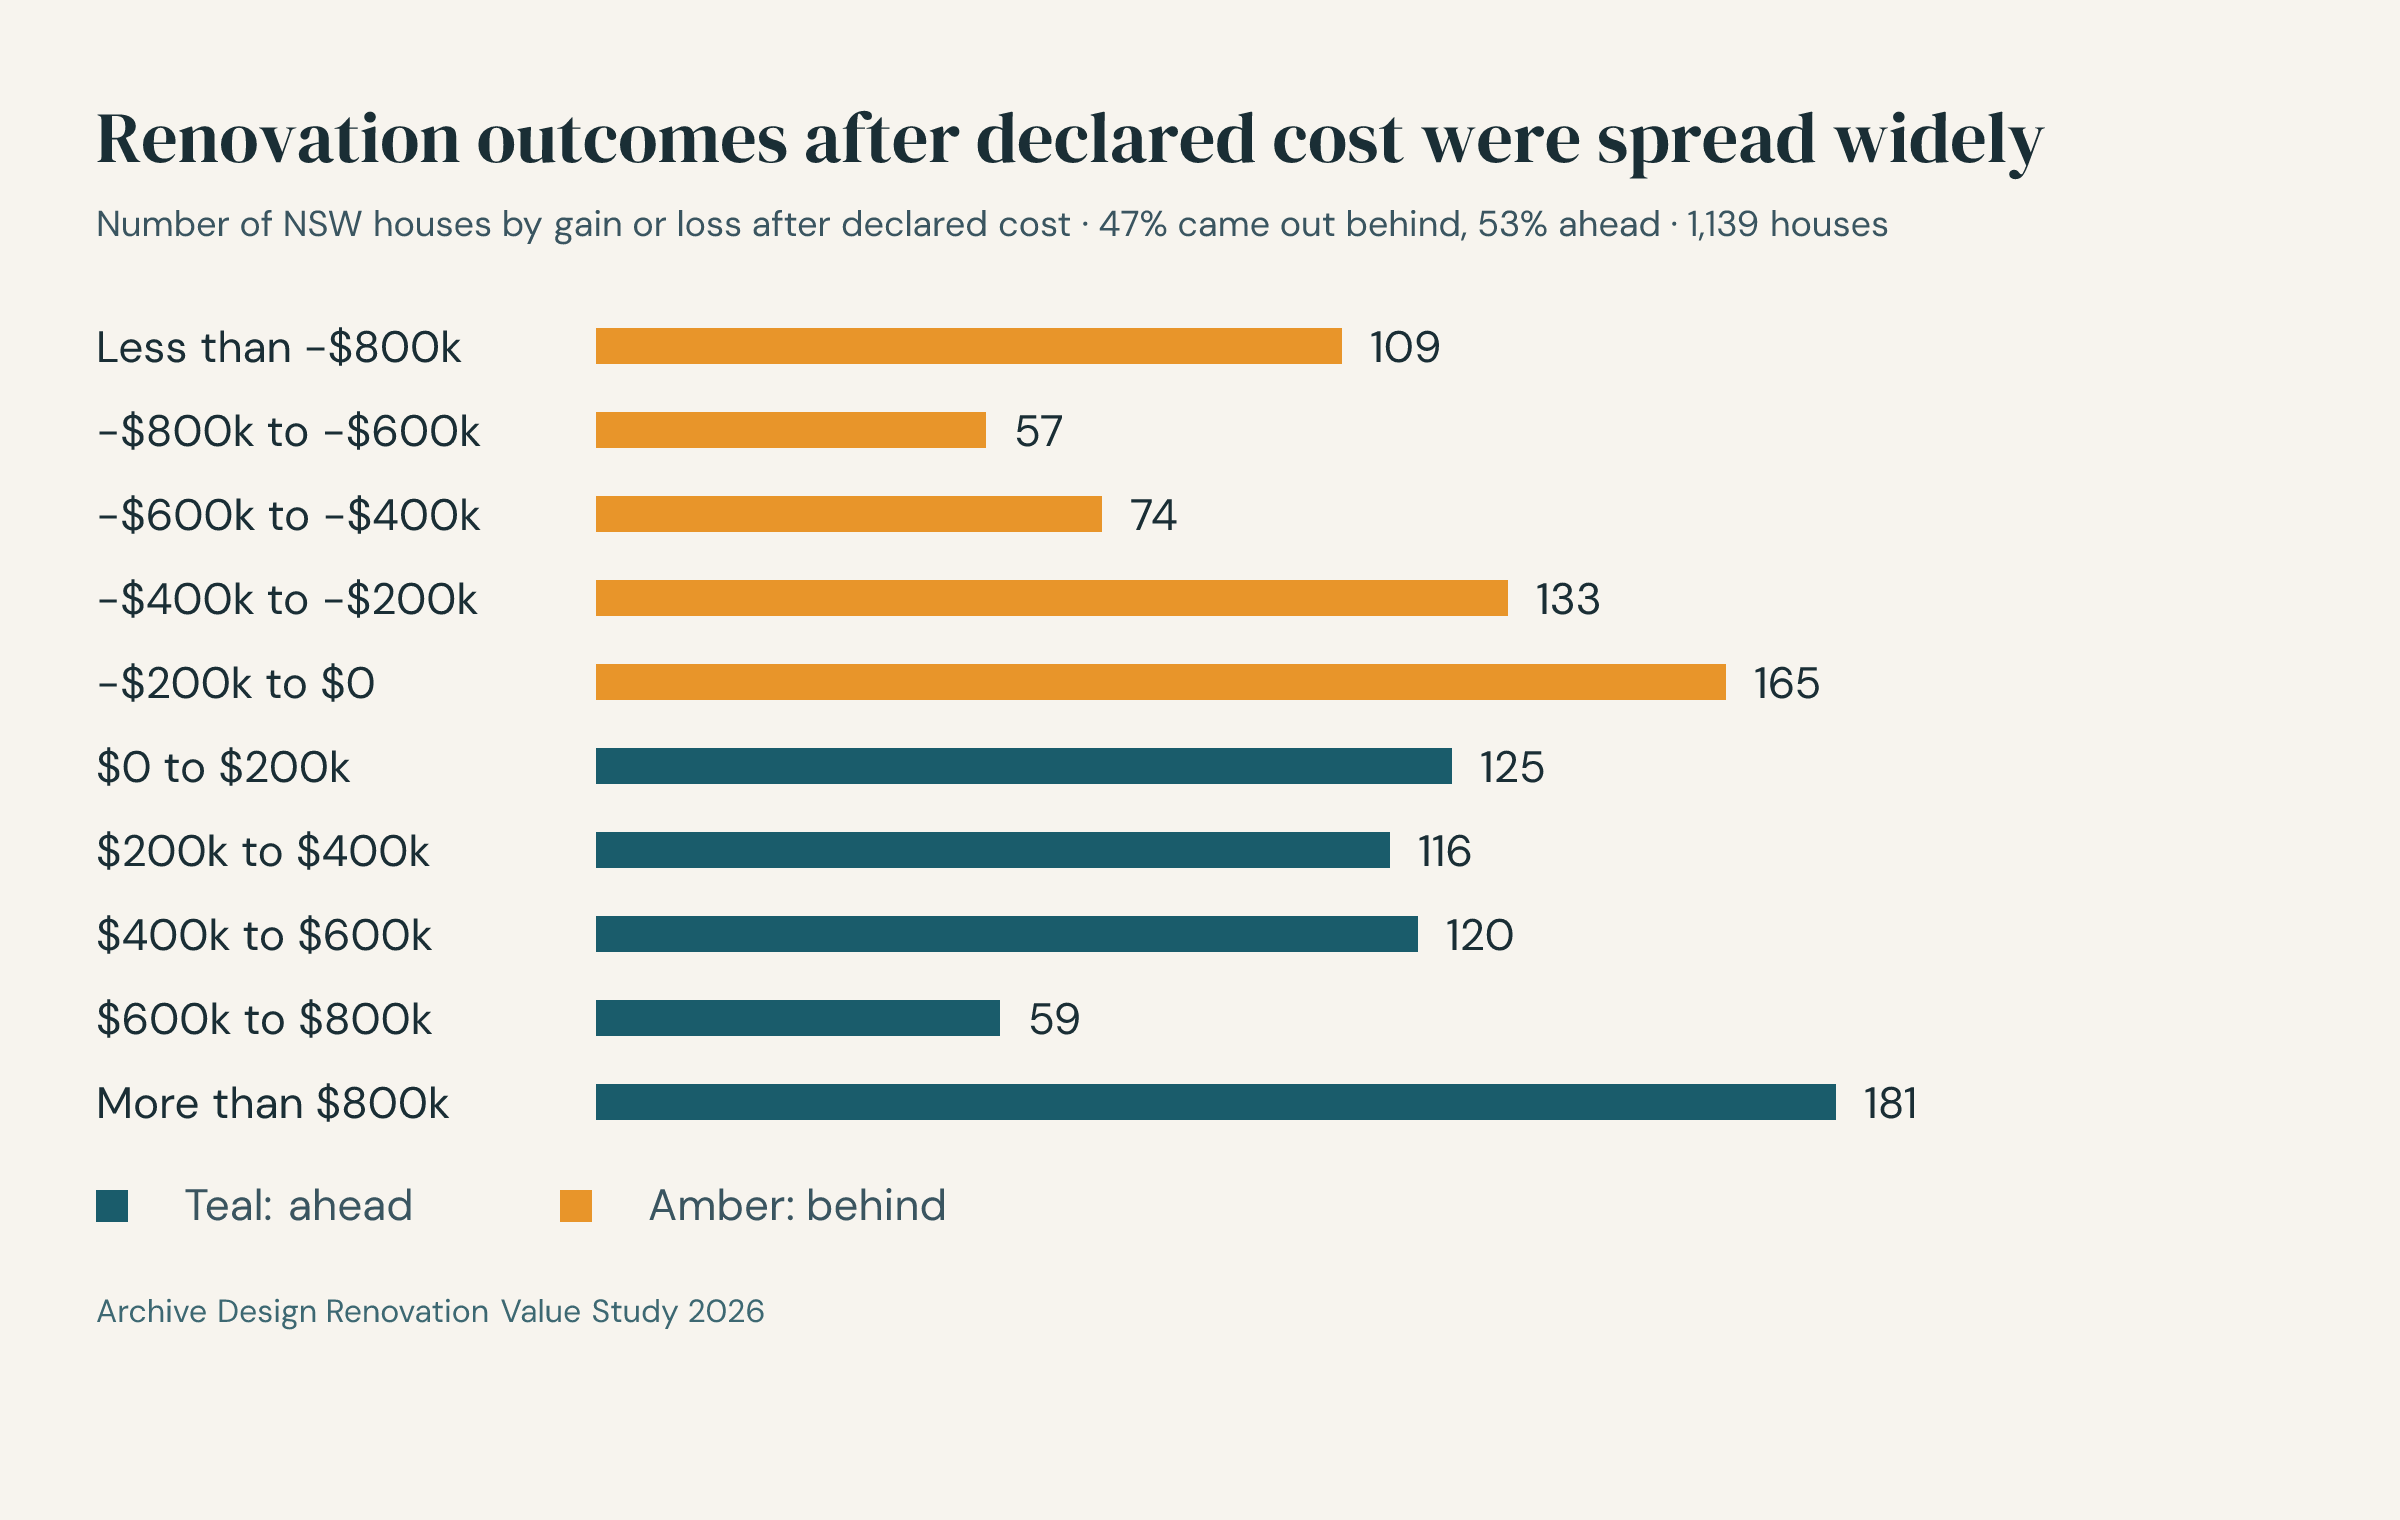
About one in six houses (181) came out more than $800,000 ahead, while about one in ten (109) finished more than $800,000 behind.
| Outcome after declared cost | Share of houses |
|---|---|
| Ahead | 53% |
| Behind | 47% |
| Ahead by $526,000 or more | 25% |
| Behind by $338,000 or more | 25% |
Show data table
| Gain or loss after declared cost | Houses | Direction |
|---|---|---|
| Less than −$800k | 109 | Behind |
| −$800k to −$600k | 57 | Behind |
| −$600k to −$400k | 74 | Behind |
| −$400k to −$200k | 133 | Behind |
| −$200k to $0 | 165 | Behind |
| $0 to $200k | 125 | Ahead |
| $200k to $400k | 116 | Ahead |
| $400k to $600k | 120 | Ahead |
| $600k to $800k | 59 | Ahead |
| More than $800k | 181 | Ahead |
The typical house in the study cost $1.45 million before the work. It resold a median of 32.5 months after the development application was lodged.
Which NSW areas get the best return from renovating?
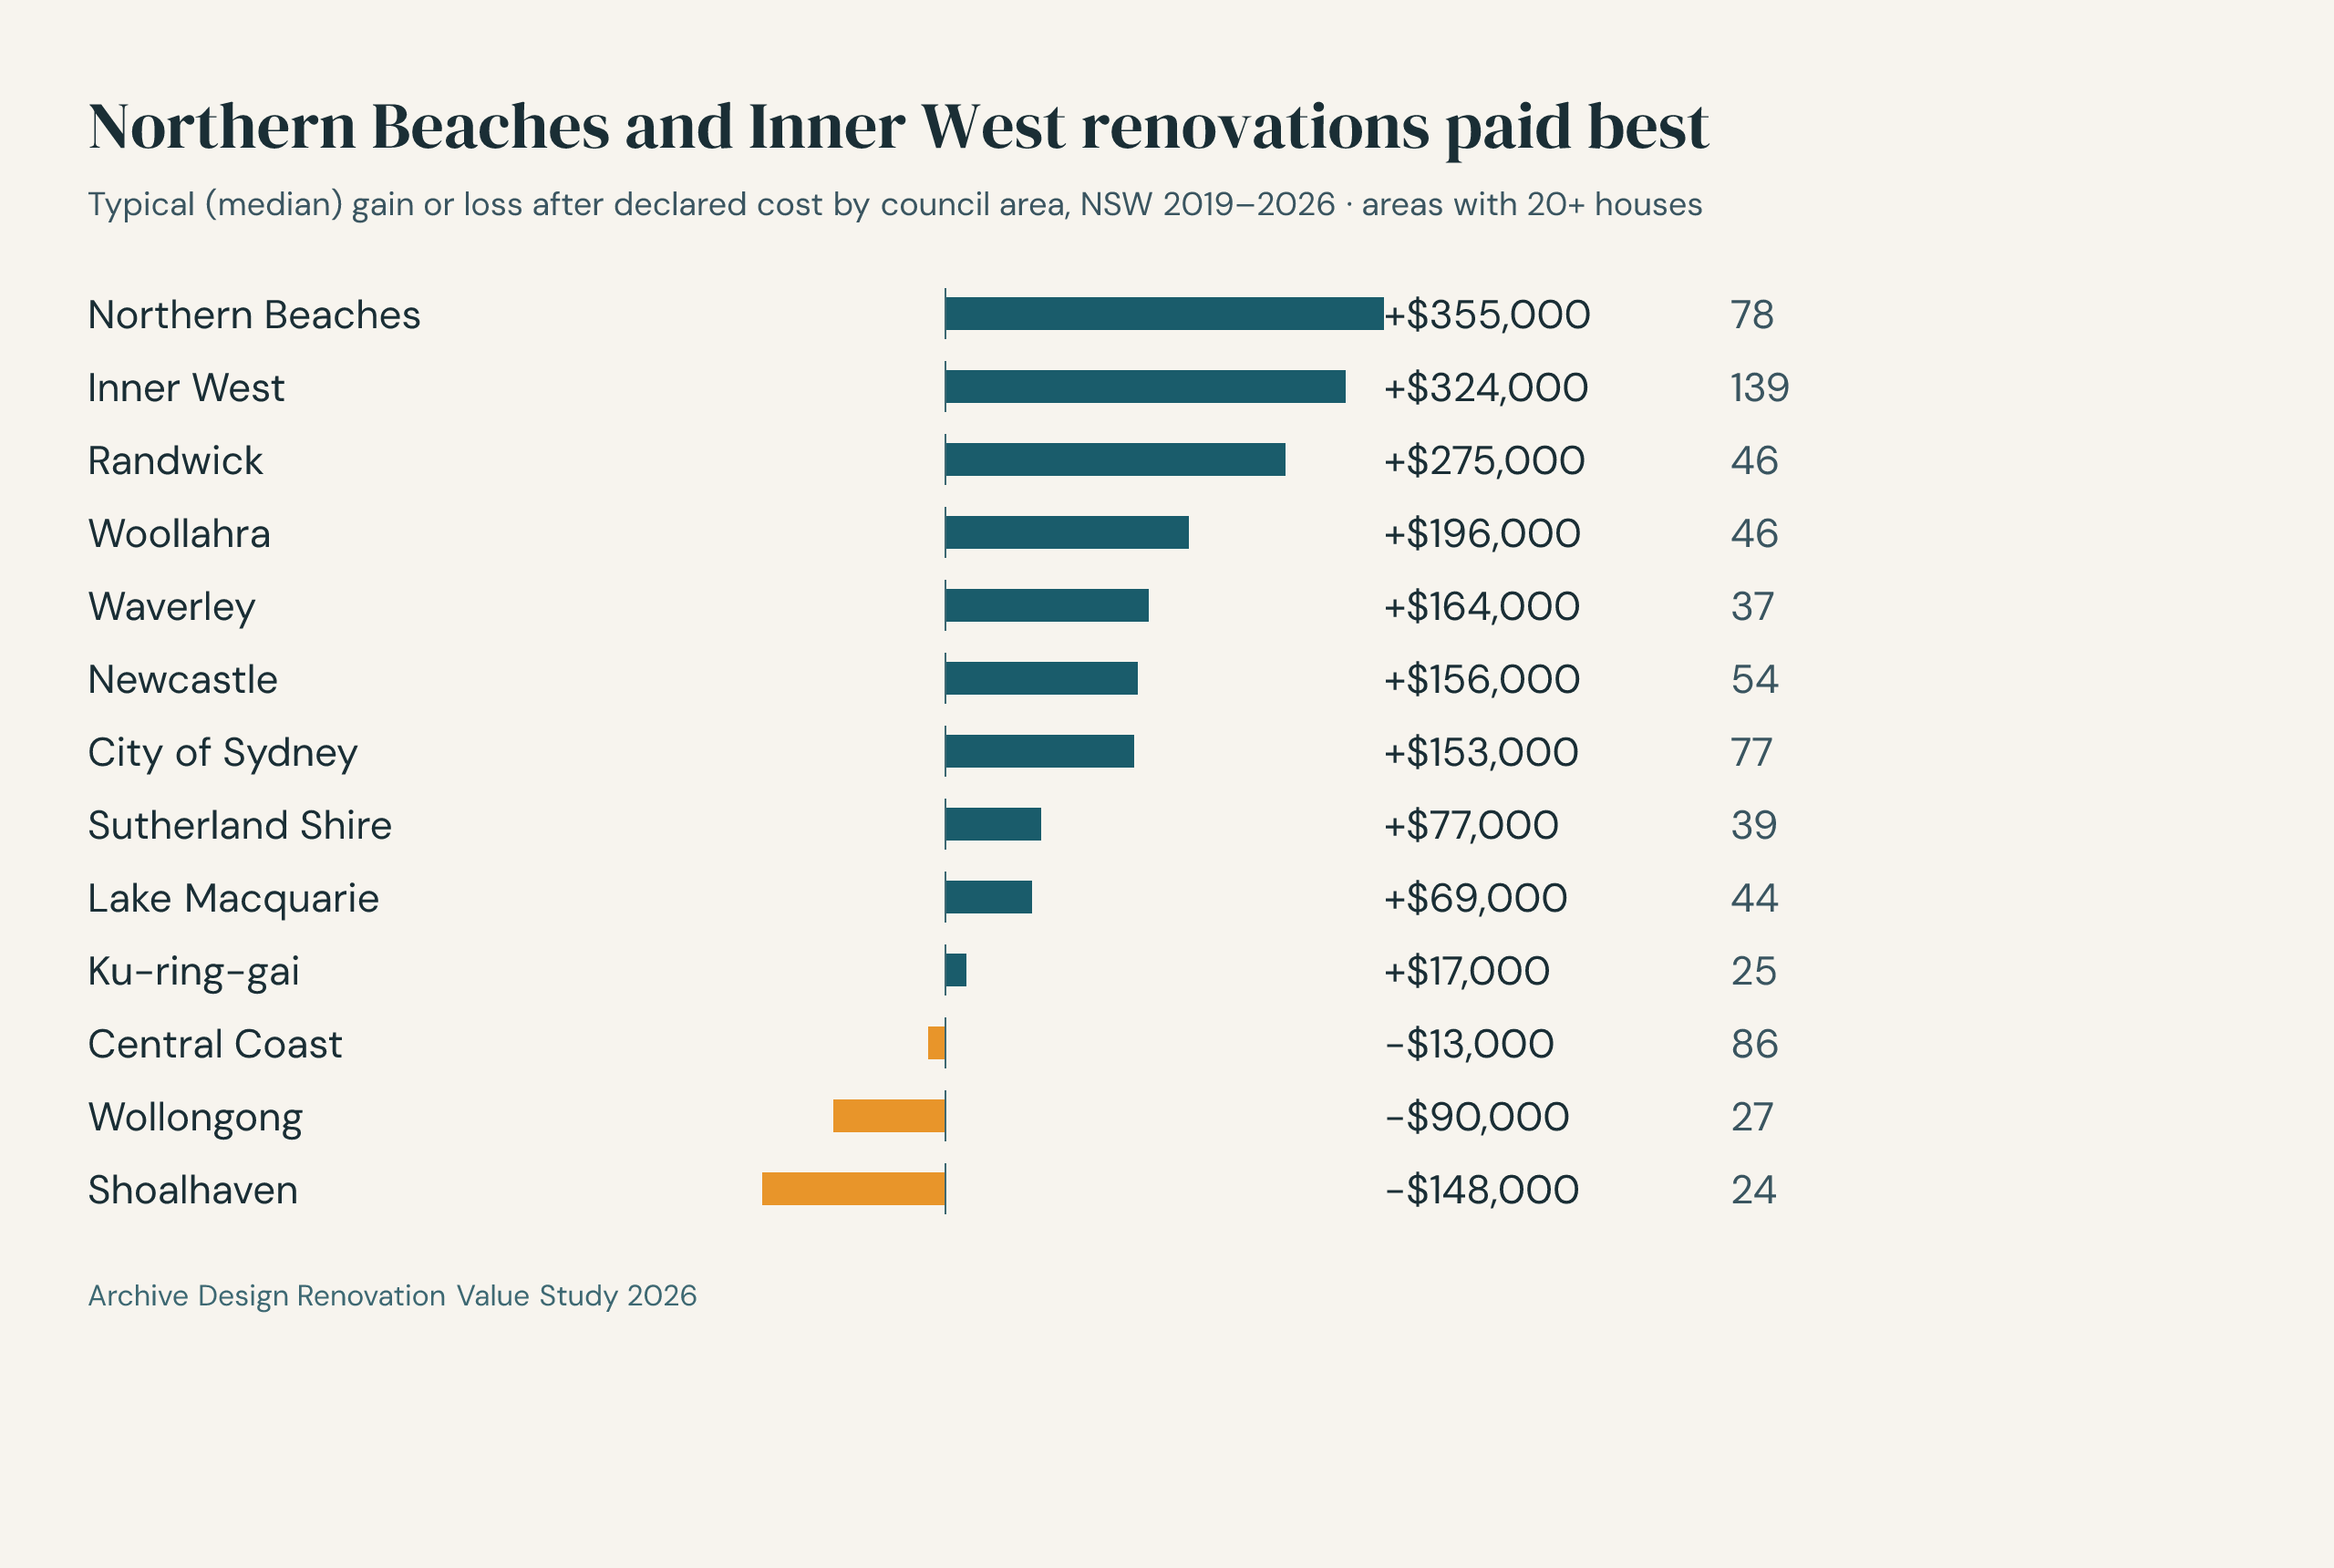
Results were strongest in parts of Sydney's inner and coastal suburbs, and weakest in several lower-priced coastal markets. The analysis doesn't isolate why. One possible reason, which this study doesn't test, is that buyers in high-demand areas pay more for a finished house.
Northern Beaches and Inner West renovations paid best
Typical (median) gain or loss after declared cost by council area, NSW 2019–2026 · areas with 20+ houses
- Northern Beaches78 houses
- Inner West139 houses
- Randwick46 houses
- Woollahra46 houses
- Waverley37 houses
- Newcastle54 houses
- City of Sydney77 houses
- Sutherland Shire39 houses
- Lake Macquarie44 houses
- Ku-ring-gai25 houses
- Central Coast86 houses
- Wollongong27 houses
- Shoalhaven24 houses
Small samples: treat single-area figures as indicative.
| Area | Houses | Typical gain or loss after declared cost | Share ahead |
|---|---|---|---|
| Northern Beaches | 78 | +$355,000 | 60% |
| Inner West | 139 | +$324,000 | 65% |
| Randwick | 46 | +$275,000 | 59% |
| Woollahra | 46 | +$196,000 | 52% |
| Waverley | 37 | +$164,000 | 51% |
| Newcastle | 54 | +$156,000 | 56% |
| City of Sydney | 77 | +$153,000 | 56% |
| Sutherland Shire | 39 | +$77,000 | 62% |
| Lake Macquarie | 44 | +$69,000 | 59% |
| Ku-ring-gai | 25 | +$17,000 | 52% |
| Central Coast | 86 | −$13,000 | 48% |
| Wollongong | 27 | −$90,000 | 41% |
| Shoalhaven | 24 | −$148,000 | 25% |
| All Greater Sydney | 731 | +$114,000 | 55% |
| All regional NSW | 408 | −$11,000 | 48% |
Only council areas with at least 20 cases are listed. With samples this small, single-council figures are indicative rather than precise.
Where renovation paid least:
- Shoalhaven (South Coast) had the weakest record. Only about one in four houses came out ahead, with a typical loss of $148,000.
- Wollongong came out ahead 41% of the time, with a typical loss of $90,000, despite modest budgets (a typical $141,000).
- Central Coast was close to break-even but slightly negative, with fewer than half ahead.
Shoalhaven, Wollongong and the Central Coast are lower-priced coastal markets. This study can't tell whether spending, the houses themselves or local market conditions explain their weaker results.
Council medians also mix location with how much owners spent. Ku-ring-gai (typical cost $600,000, typical gain $17,000) and Woollahra (typical cost $556,000, typical gain $196,000) both had large typical budgets, yet their results were very different. This paper doesn't separate the effect of location from the effect of spending.
How much should you spend on a renovation?
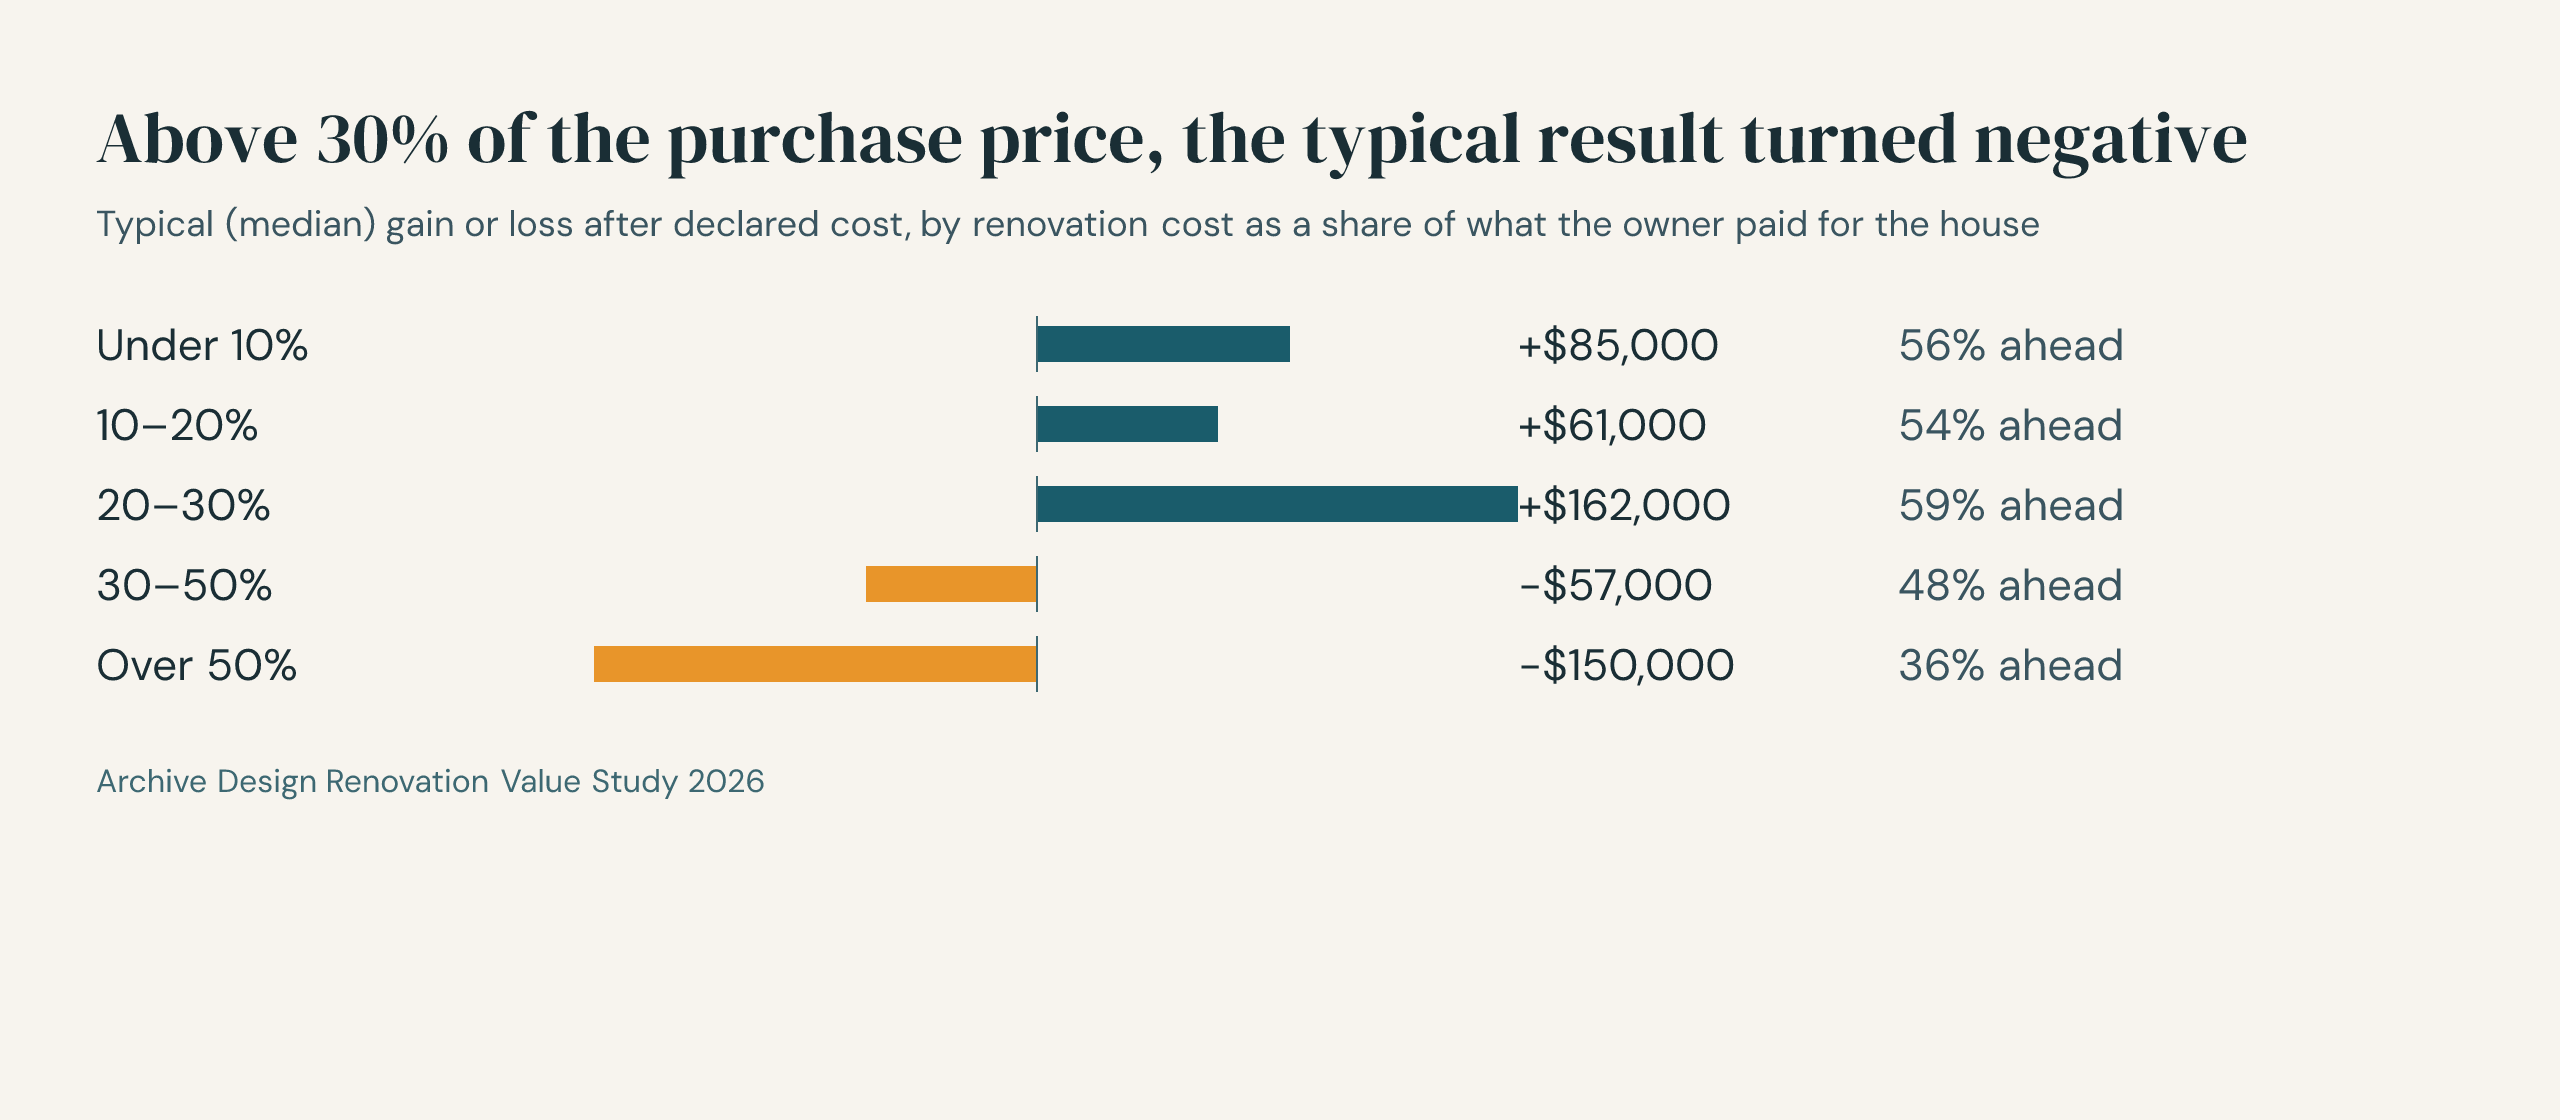
The clearest pattern in the data is how much owners spent relative to what they paid for the house. Below 30% of the purchase price, the median result was positive in every band, although only 54–59% of houses in those bands came out ahead. Between 30% and 50%, 48% came out ahead, with a typical loss of $57,000. Above 50%, results were weakest: 36% came out ahead, with a typical loss of $150,000.
Above 30% of the purchase price, the typical result turned negative
Typical (median) gain or loss after declared cost, by renovation cost as a share of what the owner paid for the house
Show data table
| Spend as a share of purchase price | Houses | Typical gain or loss after declared cost | Share ahead |
|---|---|---|---|
| Under 10% | 231 | +$85,000 | 56% |
| 10–20% | 340 | +$61,000 | 54% |
| 20–30% | 236 | +$162,000 | 59% |
| 30–50% | 225 | −$57,000 | 48% |
| Over 50% | 107 | −$150,000 | 36% |
The typical owner spent about 20% of the purchase price. A similar pattern shows in dollar terms: projects costing $300,000 to $500,000 had the best typical result ($216,000 ahead), while projects over $500,000 typically lost money.
| Declared cost | Houses | Median declared cost | Typical gain or loss after declared cost | Share ahead |
|---|---|---|---|---|
| Under $150k | 290 | $100,000 | +$75,000 | 59% |
| $150k–$300k | 327 | $221,000 | +$1,000 | 50% |
| $300k–$500k | 290 | $400,000 | +$216,000 | 57% |
| $500k–$1m | 180 | $660,000 | −$351,000 | 46% |
| Over $1m | 52 | $1,339,000 | −$1,647,000 | 35% |
The largest band, $150,000 to $300,000, was about break-even, so $216,000 is the best band's result, not the typical project's. The over-$1m row covers only 52 houses and is indicative.
So the finding isn't simply "spend less": budget relative to the house's value is what the results track most closely. Spending share can also reflect things this study doesn't see, such as the house's condition and the scope of the work. The spend bands are also different kinds of house: the typical house in the under-10% band was bought for $1,850,000, while the typical house in the over-50% band was bought for $750,000. Purchase price, location and spending share move together, and this study doesn't separate them.
How do you plan a renovation that pays?
Steps 1 and 2 draw on associations in this data, involving declared cost relative to purchase price and location. They don't prove cause. Steps 3 and 4 are general good practice, not something this study measured.
- Set the budget against the house's value, first. Before any design work, work out what the house is worth and what similar renovated houses in your street sell for. In this study, the median result turned negative once spending passed 30% of the purchase price, and only 36% of owners who spent more than half came out ahead.
- Design for your market, not just your wish list. Results differed a lot between areas. Work out what buyers in your street pay extra for, and what they don't.
- Test options on paper. Changing a design is far cheaper than changing a building. Compare layouts, scope and budget before committing to one.
- Get advice at the start. Budget and scope are set early, when professional advice can still help test them. This study doesn't measure the financial effect of that advice. If you're weighing up professional design help, see Do I need an architect?.
These are the decisions an architect typically works through with a client at the briefing and feasibility stage, before design begins: what the house is worth, what the budget should be, and what buyers in the area value. This study doesn't measure whether that advice changes the result.
What other research says about design and property value
A handful of published and forthcoming studies have looked at renovation returns, design and property value. None measures exactly what this paper does, and each has limits: the closest Australian work looks at renovation returns in general, while the others suggest design can show up in price.
- Renovation returns across Australia (forthcoming). Upcoming research from Macquarie Business School, described by Professor Vito Mollica in API Magazine in July 2026, links about one million repeat sales of Australian homes to council development applications and measures returns after construction costs and broader market movements. It hasn't yet been published. As described, major renovations returned about 2.4% less than comparable homes that were bought, lived in and sold without substantial redevelopment; extensions and alterations were, on average, financially neutral; and knock-down rebuilds overcapitalised by about 10%. Its extensions-and-alterations result sits alongside this paper's finding that the typical result was close to break-even, although it is national, covers more project types and reports a percentage return rather than a dollar margin.
- Architect-led renovations in Melbourne. A 2020 University of Melbourne study for Architeam compared 22 houses renovated by small-practice architects with 22 non-architect renovations matched on location, ideally in the same street. The architect-renovated houses grew in value about 1.2 percentage points a year faster. The sample was small, and the study didn't net off renovation cost.
- Distinctive design. A 2026 London School of Economics discussion paper by Ahlfeldt, Pietrostefani and Zhang estimated that buildings with distinctive design sell for about 15% more, and lift the value of nearby properties by about 9%. It also estimated they cost about 25% more to build, so the premium doesn't automatically cover the extra cost.
- Iconic architecture. A 2012 study of Oak Park, Illinois found homes within 50 to 100 metres of a Frank Lloyd Wright building sold for about 8.5% more. That's a famous architect's work, not a typical renovation.
The design studies come from other cities and measure different things, so their figures can't be applied to NSW renovations. They're the reason the next question is worth testing here.
Does the designer make the difference?
The renovations that paid off kept the budget in proportion to the house and suited their market. The natural next question is whether professional design helps more homeowners get there, and whether it shows up in the sale price. Does it lift the odds above a coin flip? The best typical results in this study came from mid-sized projects, at $300,000 to $500,000. Whether who designed them made the difference is what our next study will test.
Public data can't answer this yet, because NSW records don't say who designed a renovation. So Archive Design is running a follow-up study comparing architect-led renovations with the rest, using the same method and the same 2019 to 2026 data.
Architects: take part. We're asking practices to share the street addresses of houses they've renovated or designed in NSW since 2019. Addresses are used only to match public sale records. No client names are collected and no individual project is published, with results reported in aggregate only. Email us to contribute.
That study will show whether results differ between architect-led and other projects, after accounting for location, budget, scope and timing. On its own, it won't prove that design caused any difference. Whatever it finds, homeowners deserve to know, and we'll publish it.
How was this study done?
- Selected renovation applications. We took all development applications in NSW lodged from 2019 to October 2026 from the NSW Planning Portal, and kept the 48,189 for alterations and additions to a single house. Subdivisions, new dwellings and multi-unit projects were excluded, as were withdrawn, rejected and cancelled applications. Cost is the estimated development cost the applicant declared.
- Every house sale. We took 782,051 sales of non-strata houses from the NSW Valuer General's public records. Most fall between 2019 and October 2026; a few earlier sales appear because sales are listed by the date they were recorded.
- Before and after. We matched applications to sales by street address. A house counts when it sold before the application was lodged and again at least 18 months after, which leaves time for the work to be built. That's why most of the 48,189 applications don't appear in the results. Without the same-property check below, the sample is 1,202 houses. We then kept only houses where both sales carry the same Valuer General property ID or the same land area (within 5%). That excluded 63 cases whose two sales had different property IDs and land areas more than 5% apart, which suggests a mismatch, subdivision or amalgamation, and left 1,139 houses across 83 council areas. Requiring the same property ID alone gives very similar results (see below).
- Allowing for the market. Prices rose strongly over the period, so we compared each house with what it would have sold for anyway. We estimated each council area's price growth from 101,586 houses that sold twice with no development application on record. Gain after declared cost = later sale price, minus the earlier price grown at the local market rate, minus the declared cost.
Robustness checks and limits
How robust are the results? We reran the analysis under alternative assumptions. The share of houses ahead and the poor results above 50% spending held up in every version. The size of the typical gain did not, so we describe it as close to break-even rather than relying on the exact figure. The choice that mattered most was the market comparison: using one Greater Sydney index and one regional index, instead of an index for each council, put the typical result slightly below break-even.
| Version | Houses | Share ahead | Typical gain after declared cost | Share ahead when spend > 50% of purchase price |
|---|---|---|---|---|
| As published (1,139 houses, same property confirmed) | 1,139 | 53% | +$45,000 | 36% |
| Without the same-property check | 1,202 | 52% | +$34,000 | 35% |
| Same property ID required (land-area match not accepted) | 1,102 | 53% | +$44,000 | 36% |
| Resale at least 12 months after the application | 1,414 | 49% | −$7,000 | 32% |
| Resale at least 24 months after the application | 894 | 52% | +$28,000 | 33% |
| Older development-type category only | 1,009 | 53% | +$43,000 | 37% |
| Determined applications only | 1,139 | 53% | +$45,000 | 36% |
| Latest application per house, not earliest | 1,099 | 53% | +$43,000 | 36% |
| Postcode added to the address match | 1,139 | 53% | +$45,000 | 36% |
| Symmetric outlier rule (2.5× either way) | 1,137 | 52% | +$35,000 | 33% |
| No outlier rule | 1,154 | 52% | +$37,000 | 38% |
| One Greater Sydney and one regional market index, instead of council indices | 1,139 | 49% | −$8,000 | 33% |
| Declared cost understated by 10% (cost increased by 10%) | 1,139 | 51% | +$21,000 | 34% |
| Declared cost understated by 20% (cost increased by 20%) | 1,139 | 50% | −$2,000 | 31% |
| Strictest choices combined | 895 | 51% | +$20,000 | 31% |
Limits. Declared costs tend to be understated, because council fees rise with cost, so true margins are probably lower than shown: if costs were understated by 20%, the typical result would be about break-even (−$2,000; see the robustness table). A lodged development application isn't proof the work was approved, finished, or done at all, and the records don't show when it was completed. Unbuilt work and understated declared costs push the measured margin in opposite directions. Houses bought to renovate may have been bought below market, which flatters the result. Owners who renovate and sell within a few years aren't typical. The market comparison uses houses with no development application on record, but some will have had renovations that didn't need one. Each sale is assigned to a council by postcode, and some postcodes cross council boundaries. Address matching misses some cases, and 23 matches with implausible price swings were removed. Results are pooled across 2019 to October 2026, a period that included a price boom and a rise in interest rates, and this paper doesn't split them by year. These figures describe what happened to houses that were later sold, not a forecast for any one home.
Frequently asked questions
Does renovating add value to a house in NSW?
Often, but not always enough to cover the cost. In the Archive Design Renovation Value Study 2026, which covers 1,139 NSW houses resold after a development application for alterations and additions, 53% sold for more than local market growth plus the declared cost, before selling costs, interest and tax. The typical result was close to break-even.
What is over-capitalising?
Over-capitalising means spending more on a renovation than it adds to the property's value. In this study, the median result turned negative once the renovation cost more than 30% of what the owner paid for the house. When it cost more than half the purchase price, only 36% of owners came out ahead.
How much value does a renovation add in Sydney?
In Greater Sydney, the typical renovated house in this study came out about $114,000 ahead after declared cost, and 55% came out ahead, compared with 48% in regional NSW. The dollar figure is sensitive to how market growth is measured, so treat it as indicative. Results varied widely by area: 65% came out ahead in the Inner West.
What renovation budget gives the best return?
Budget relative to the house's value tracked results more closely than the dollar amount. Below 30% of the purchase price, the median result was positive in every spending band. In dollar terms, projects of $300,000 to $500,000 had the best typical result (+$216,000), and projects over $500,000 typically lost money.
Is it worth renovating before selling?
This study followed owners who lodged a renovation application and then sold, a median of 32.5 months after lodging. About half came out ahead after declared cost, before selling costs, interest and tax. In this sample, a higher share came out ahead where spending stayed below 30% of the purchase price and in Greater Sydney. These are associations, not forecasts.
Do architect-designed renovations add more value?
This study doesn't answer that yet, because NSW public records don't show who designed a renovation. Other research points that way: a 2020 Melbourne study of 22 architect-led and 22 matched non-architect renovations found the architect-led houses grew in value about 1.2 percentage points a year faster, though it was small and didn't account for project cost. Archive Design is now running a NSW study comparing architect-led renovations with the rest.
Where does the data come from?
All figures use public NSW Government data: property sales from the NSW Valuer General and development applications from the NSW Planning Portal, from 2019 to October 2026. See How was this study done? for the method and its limits.
About this paper
- Publisher: Archive Design
- Author: Archive Design Research Team
- Analysis: Archive Design, using public NSW Government data accessed 20 October 2026. Two rounds of independent AI-assisted review checked the analysis code, outputs and selected reruns from the raw data. The limits described in this paper remain.
- Disclosure: Archive Design matches homeowners with architects and earns a fee when a homeowner goes ahead with an introduction. This paper does not find or claim that architect-designed renovations perform better; that question is the subject of a separate study.
How to cite this paper
Archive Design Research Team (2026). What the NSW renovations that paid off had in common. Archive Design Renovation Value Study 2026, Research v1. https://www.archivedesign.ai/research/does-renovating-pay-nsw
Sources
- NSW Valuer General, bulk property sales information (Creative Commons)
- NSW Planning Portal, OnlineDA data API
- Mollica, V., "Australians love renovating but research shows most don't make money doing it", API Magazine (15 July 2026)
- Raisbeck, P. for Architeam and the University of Melbourne, "Do small practice architect designed renovations improve capital gains in the Melbourne residential property market?" (2020)
- Ahlfeldt, G., Pietrostefani, E. and Zhang, A., "The economics of architecture", CEP Discussion Paper 2150, London School of Economics (2026)
- Ahlfeldt, G. and Mastro, A., "Valuing iconic design: Frank Lloyd Wright architecture in Oak Park, Illinois", Housing Studies (2012)
Data credits
- Property sales data: Bulk Property Sales Information, © State of New South Wales through the NSW Valuer General, used under a Creative Commons Attribution licence.
- Development application data: © State Government of NSW and NSW Department of Planning, Housing and Infrastructure 2021, used under a Creative Commons Attribution licence.
Archive Design has combined, filtered and analysed this data. The findings and any errors are Archive Design's own. The NSW Government has not reviewed or endorsed them.
Important information
This paper is general information about past property sales in NSW. It isn't financial, investment, valuation or building advice, and it doesn't predict what any particular renovation will return. Results describe the median of groups of houses, and individual outcomes varied widely. Before making decisions about your property, get advice from qualified professionals who know your circumstances, such as a valuer, financial adviser, builder or designer.
While we have taken care in preparing this analysis, it relies on public records that may contain errors or omissions, and on the limits described in How was this study done?. Archive Design accepts no liability for decisions made on the basis of this paper.
Archive Design Renovation Value Study 2026